The NISE Net runs a series of online brown-bag conversations focused on helping partners share their work and learn from others in the Network. The aim of the online brown-bag conversations is to increase the number of professional development opportunities available to our partners, create more channels for Network partners to learn from each other directly, and create ways for partners to follow-up on ideas or efforts that emerge at in-person meetings.
The Science Behind NanoDays 2015 - Part 1
Wednesday, February 18, 2015
2pm - 3pm ET / 11am - 12pm PT
Presenter
Lizzie Hager-Barnard of the Lawrence Hall of Science (UC Berkeley)
Are you interested in learning more about the science behind the NanoDays activities? Do you want to know more about how the NanoDays activities are related to cutting-edge research? Then please join us for an exciting presentation and discussion.
This brown-bag will focus on the applications and scientific background behind NISE Net activities related to graphene and nano-coatings. We will cover a variety of past and present NanoDays activities, including the following ones from the NanoDays 2015 kit:
- Exploring Materials - Graphene
- Exploring Properties - Heat Transfer
- Exploring Products - Kinetic Sand
The contents of the NanoDays 2015 physical kit are online and available to download!
Please note that this brown-bag is not a tutorial on the NanoDays kit. This is one of two brown-bags focused on the science behind NanoDays kit activities. The two brown-bags will focus on different topics and you are welcome to participate in one or both.
Resources
- Watch a recording of the brown-bag here
- Brown-Bag Presentation Slides
- NISE Network product page: The Science Behind NanoDays 2015 - Part 1
Background Information
- Document: Nano Bite e-newsletter stories related to nano-coatings and carbon materials (You can browse the e-newsletter and subscribe at http://www.nisenet.org/newsletter)
- Aerogels - Many people were interested in aerogels, and doing demos with them. Here are some resources related to this topic:
- NISE has a cart demo related to aerogels: http://www.nisenet.org/catalog/aerogel
- Teachersource.com sells aerogel discs: https://www.teachersource.com/product/aerogel/density
- NASA has a (fairly old) discussion about aerogels: https://science.nasa.gov/science-news/science-at-nasa/1997/msad05mar97_1/
- This website suggests different experiments you could do with aerogels: http://www.wellsj.com/library/aerogel_introduction.shtml
Forms of Carbon
During the brown-bag we talked about the phases of water and some of the solid phases (allotropes) of carbon. I had a question about how the different forms of carbon are created. To understand the conditions under which materials form, scientists create phase diagrams. This phase diagram for carbon (the image on the left below) shows that diamond forms at high pressures, while graphite forms under low pressures.

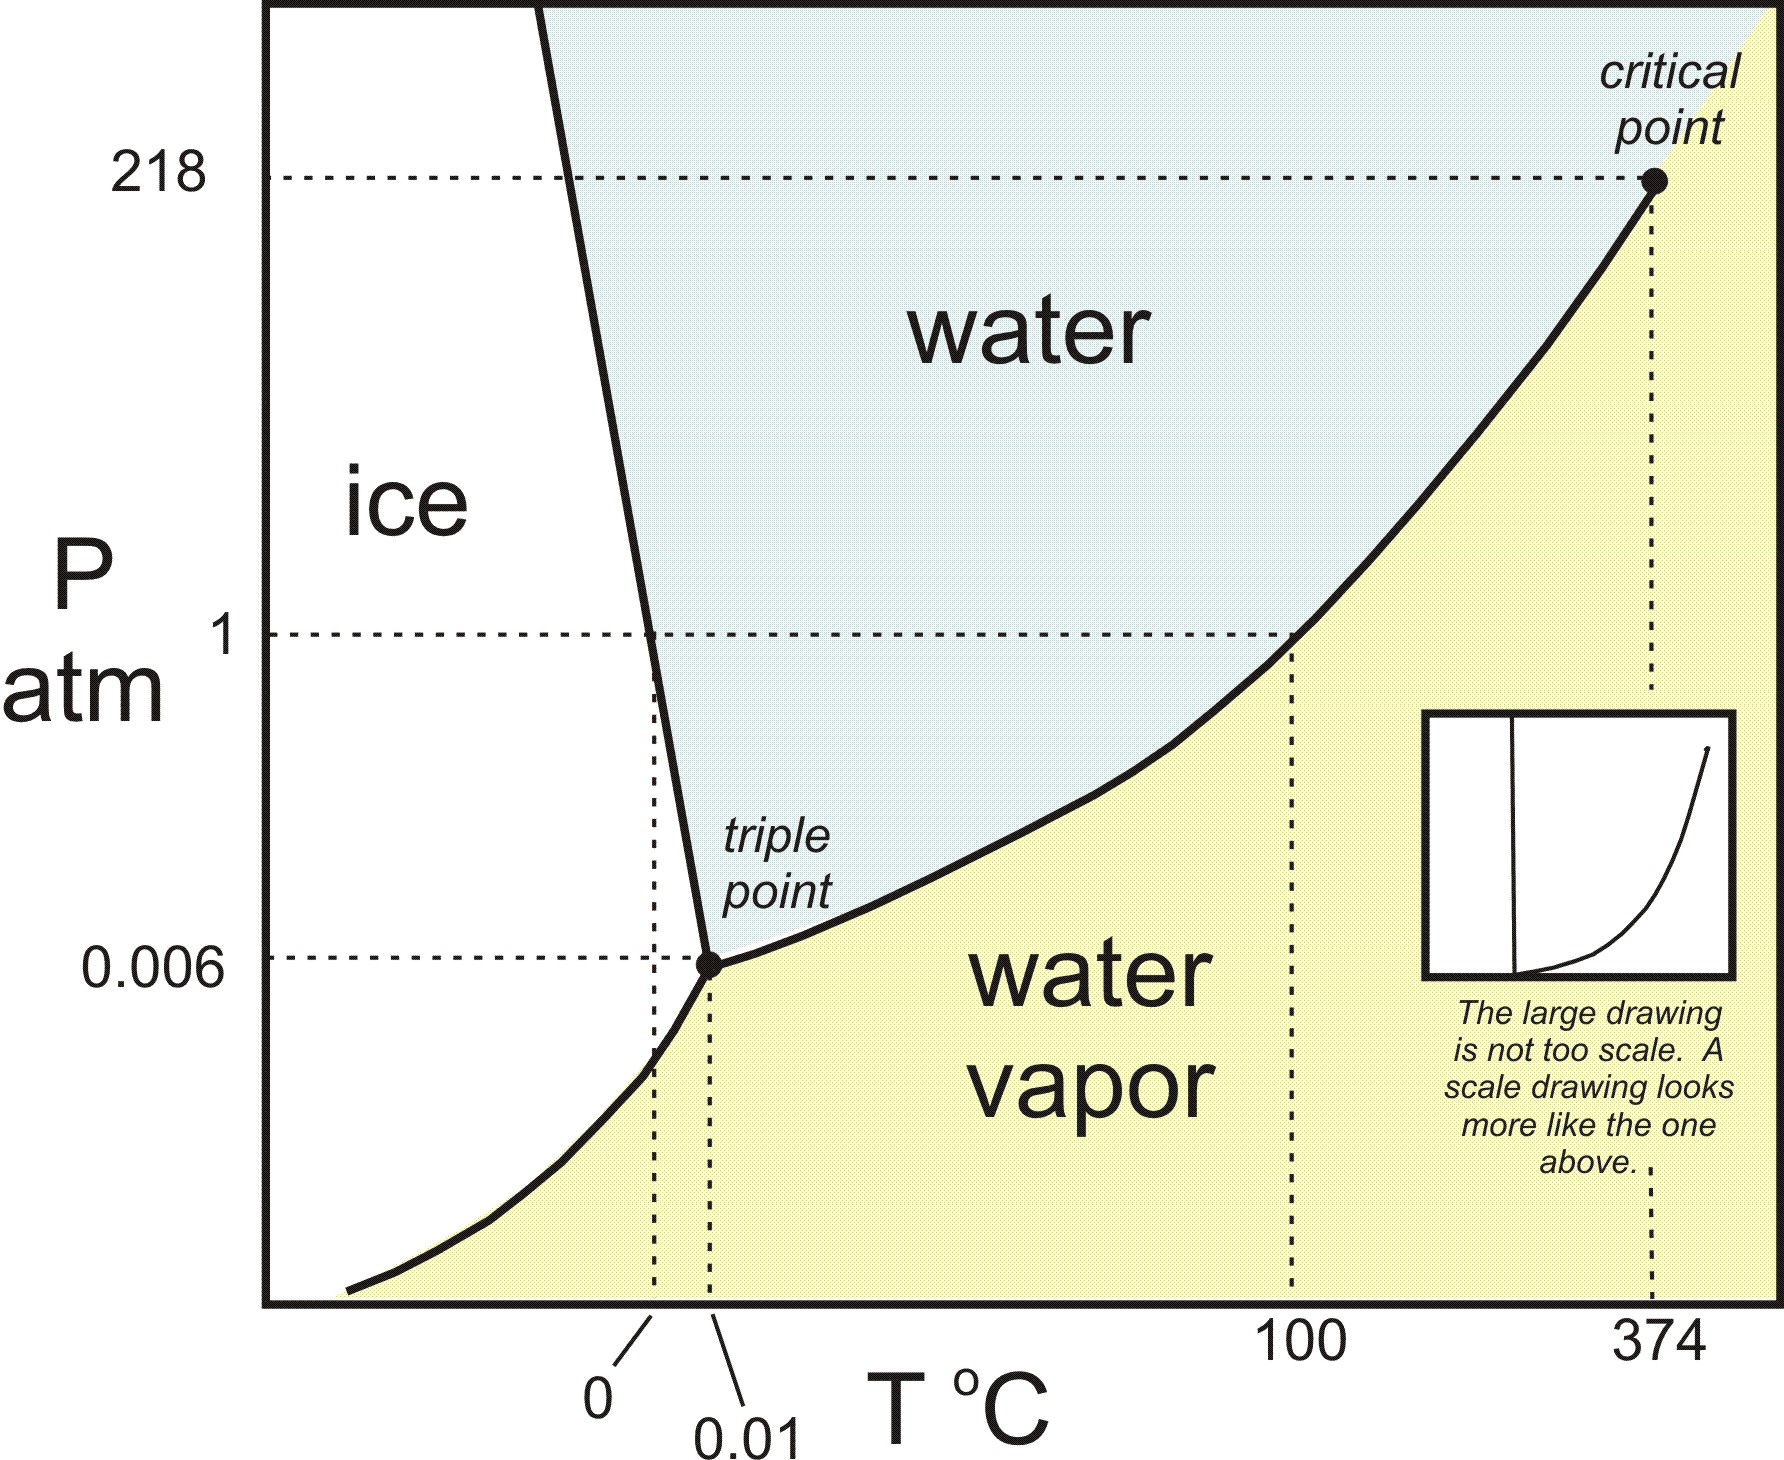
Left: Phase diagram for carbon. Right: Phase diagram for water
To relate this to water, the image above on the right shows the phase diagram for water. However, it turns out that this is a simplified phase diagram. If we widen the pressure and temperature ranges, we’d see that the full phase diagram of water is really complicated. In fact, water has multiple solid phases, just like carbon. The many phases of ice have different crystal structures (different bonding patterns) and different properties. So this might be a good analogy when talking about the different forms of carbon. You can check out this link to learn more about the phases of ice.