
How is the Earth changing over time?
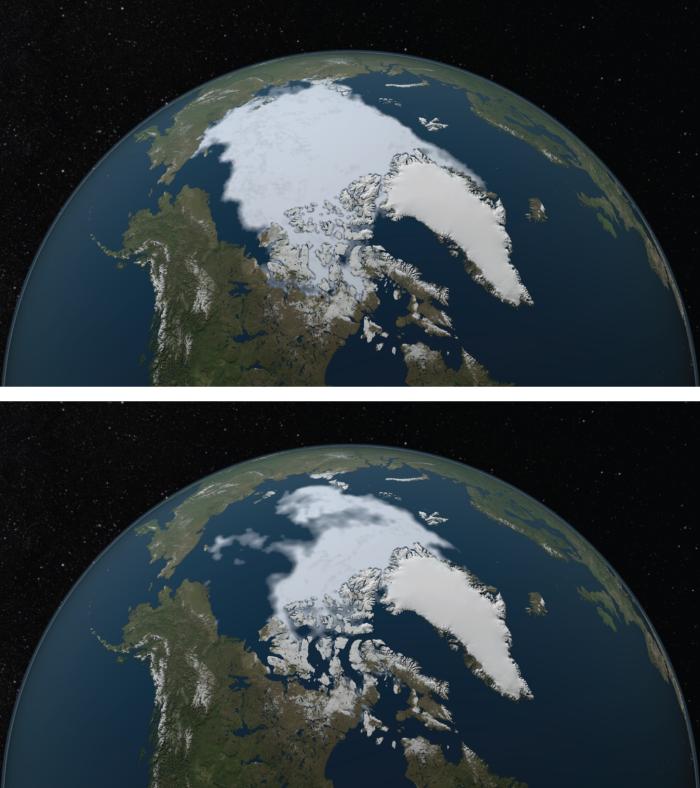
Satellite images obtained in 1984 and 2012 of sea ice. There was a record low amount of sea ice in 2012. The area of the Arctic Ocean covered in ice increases during the winter and then shrinks during the summer, usually reaching the year’s low point in September. The minimum coverage for 2012 set a record low since at least 1979, when the first reliable satellite measurements began.

These images show the Virgin Islands before and after Hurricane Irma. The 2017 storm caused significant tree loss. Hurricane Irma tore through the Virgin Islands on September 6, 2017, leaving the once-verdant landscape brown. Some of the discoloration is likely the result of vegetation being ripped away by the storm, which had sustained winds of 298 kph (185 mph), while some browning may have been caused by salt spray killing leaves and plants. The brighter appearance of the ocean in the lower image is likely caused by a choppier ocean surface than in the upper image.
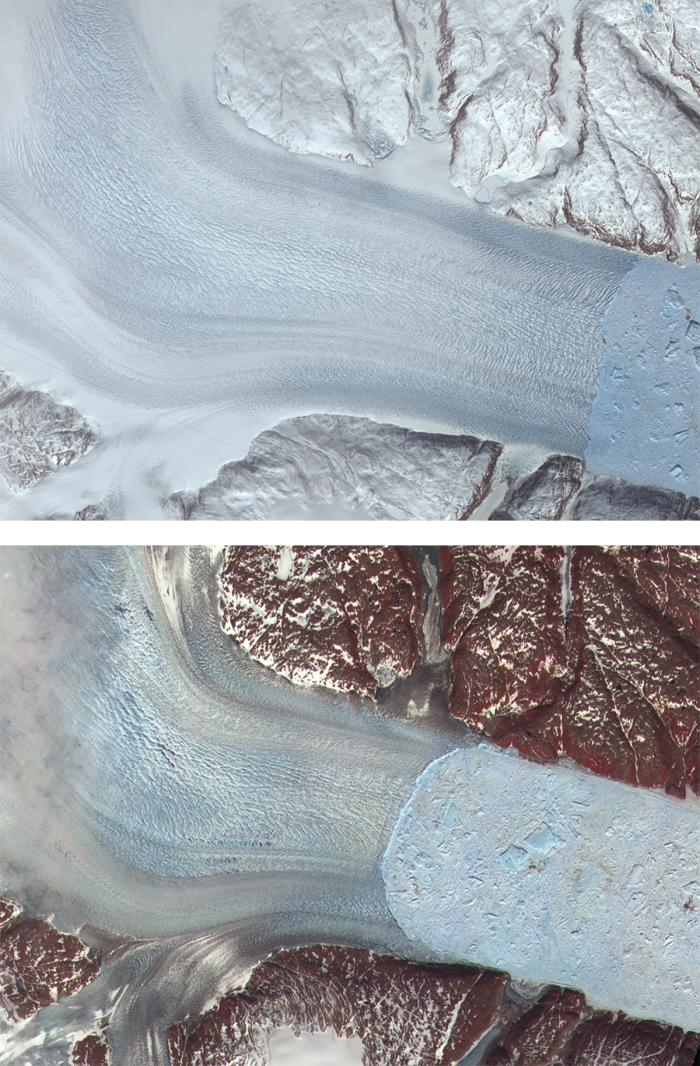
Images from 2001 and 2005 show melting of the Helheim Glacier in Greenland. These pictures show the Helheim Glacier (on the top) crumbling into large and small icebergs (light blue, on the bottom). The glacier outlet held steady from the 1970s until about 2001, then began to retreat towards its source about 7.5 kilometers (4.7 miles) between 2001 and 2005. The glacier's flow to the sea has also sped up.
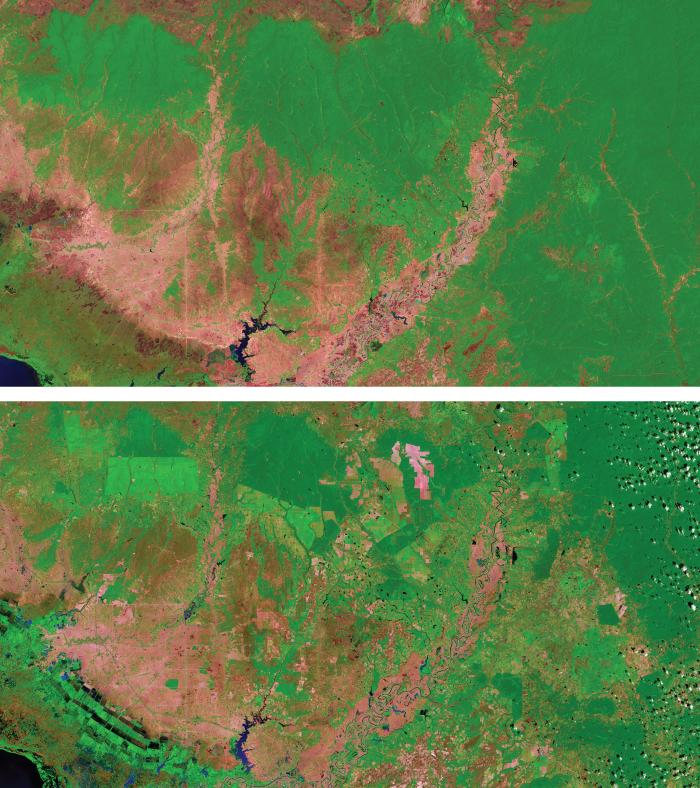
Landsat images from 1999 and 2017 show rapid forest lost in Cambodia. Cambodia had the world’s most accelerated rate of deforestation between 2001 and 2014, losing 14,400 square kilometers (about 5,560 square miles) of forests during that time due to economic changes. In these images, dark green shows forests and pinkish-tan shows old, small-plot agricultural areas. In the lower left corner of the 2017 image (right), bright green landscapes peppered with darker blocks are crops, and bright green rectangles at the top left are areas where rubber tree or oil palm plantations have emerged.
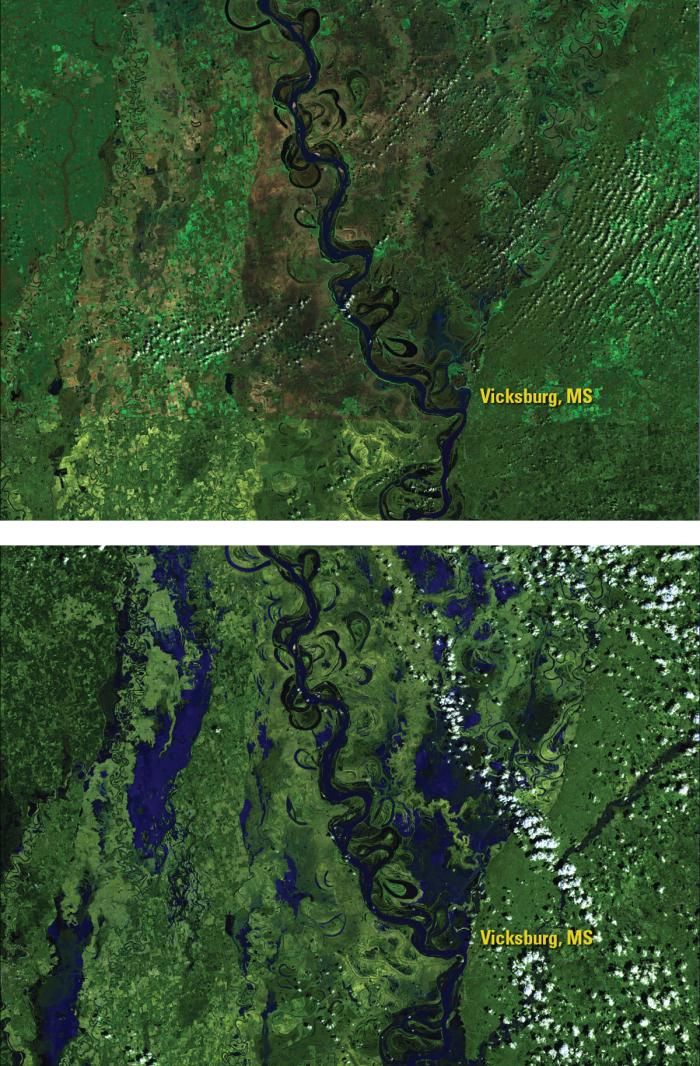
These 2016 images, taken just a few days apart, show massive flooding from the Mississippi River. Following January storms that raised the lower Mississippi River to the top of its banks, storms in March 2016 drenched areas of Louisiana, eastern Texas, Mississippi, and Arkansas with up to 51 centimeters (20 inches) of rain. Officials say the resulting flooding in Louisiana was among the most widespread for any non-hurricane event, causing evacuations and significant damage.
Video and Image credits
Sea ice record low: Images by NASA Scientific Visualization Studio. Information sources: 2012: NASA Earth Observatory, 2013: NASA Earth Observatory, 2016: NASA Global Climate Change.
Hurricane Irma: Images taken by the Operational Land Imager onboard Landsat 8. Source: NASA's Earth Observatory.
Helheim glacier: NASA images created by Jesse Allen, NASA Earth Observatory, using data from the Advanced Spaceborne Thermal Emission and Reflection Radiometer (ASTER) on NASA's Terra satellite. Courtesy of NASA/GSFC/METI/ERSDAC/JAROS, and the U.S./Japan ASTER Science Team.
Cambodian forests: Upper image taken by the Landsat 5 satellite. Lower image by Landsat 8. Source: U.S. Geological Survey (USGS) Landsat Missions Gallery: “Cambodia Experiences Rapid Rate of Forest Loss”; U.S. Department of the Interior / USGS and NASA.
Mississippi River: Images taken by the Operational Land Imager onboard Landsat 8. Source: U.S. Geological Survey (USGS) Landsat Missions Gallery; Mississippi River Floods Deep South; U.S. Department of the Interior / USGS and NASA.
Descriptive text adapted from NASA’s Image of Change website.